Writing a probability or statistics simulation to be executed by Statistics101, like writing any computer program, opens possibilities for programming errors, or "bugs". Statistics101 incorporates a debugger that allows you to observe your Resampling Stats program's variables as you step through your program. By watching how your variables change you can find and correct your program's bugs. While debugging, you can also edit the values of your program's variables in the Debug Variables window.
You control the debugger with either the Run menu, the debug toolbar, or keyboard shortcuts. The Run menu has two selections: "Debug mode" and "Step" for this purpose. Associated with these menu items are keyboard shortcuts, Ctrl-D and Ctrl-T, respectively. The "D" mnemonic is for "Debug" and the "T" is for "STep". (The "Ctrl-S" keyboard shortcut is preempted by the Save command, so it couldn't be used for "Step".)


The debug toolbar has two buttons that correspond to the two Run menu items. Usually, the toolbar buttons or the keyboard shortcuts are easier to use than the menu items. In this discussion, we'll refer to the toolbar buttons, but keep in mind that everything said also applies to the menus and the keyboard shortcuts.
With
your program
displayed in the Statistics101 Edit Window you can
start the
debugger by clicking on the Debug
mode button ![]() .
Once Statistics101 has entered debug mode, editing
is
disabled. Even if you switch back to the "Edit" tab, you
can view your program and single-step through it, but you can't edit
it until you exit debug mode.
.
Once Statistics101 has entered debug mode, editing
is
disabled. Even if you switch back to the "Edit" tab, you
can view your program and single-step through it, but you can't edit
it until you exit debug mode.
Upon
entering debug
mode, the Debug
mode
button ![]() will change into the Continue
button, which looks like this
will change into the Continue
button, which looks like this ![]() ,
and the Step
button
,
and the Step
button ![]() ,
which was previously disabled, will become enabled. The Debug
tab of the Program Panel will become selected. See Illustration 5. In
the program debug tab window, the first executable line of your
program will be emphasized by a light green highlight. The green
highlight indicates which line of your program will execute next,
when you click on the Step
button. The blue highlighted lines are breakpoints. Breakpoints will
be discussed later in this Appendix.
,
which was previously disabled, will become enabled. The Debug
tab of the Program Panel will become selected. See Illustration 5. In
the program debug tab window, the first executable line of your
program will be emphasized by a light green highlight. The green
highlight indicates which line of your program will execute next,
when you click on the Step
button. The blue highlighted lines are breakpoints. Breakpoints will
be discussed later in this Appendix.
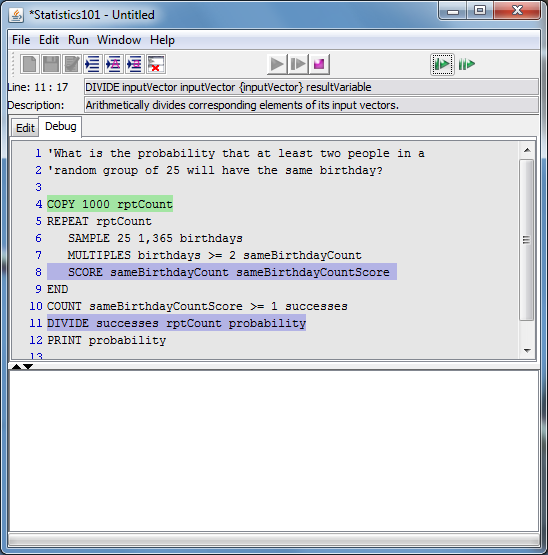
Illustration 5: Program window in
debug mode
While in Debug mode, as you step through your program you can observe the values of its variables in two ways. One way is via the Debug Variables window described in the next section. But a more direct way is simply to hover your mouse pointer over the name of a variable. (On the Mac you must click on the variable name.) This will cause a tooltip-style window to appear that displays the value of that variable. The next illustration shows this feature in operation. In the figure, the pointer is hovering over the variable DayNumber and a tooltip window shows its name, the first five elements, the last five elements, and three asterisks between them to indicate that the remaining elements have been left out for brevity. If the variable is not a GLOBAL, it will be displayed in black text as shown here. If it is a global, it will be shown in green text. This feature is available in both the Edit and the Debug tabs of the main window but only during Debug mode.
Illustration 6: Program window in
debug mode
Upon entering Debug mode, a new window will open (see Illustration 7) containing a list of all the variables in your program, and their values. That window is called the "Debug Variables" window.
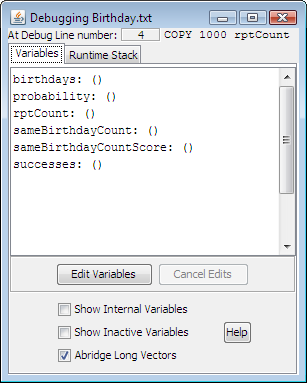
Illustration 7: Debug Variables
window
In the Debug Variables window, the title bar shows the name of the program being debugged, or "Untitled" if the program has not yet been saved to disk. Below the title bar is a status line that displays the line number and text of the command that is ready to execute next. If you double-click on the line number or the command in the status line, the program in the main Programming panel will jump to that line.
Beneath the status line are two tab windows, "Variables" and "Runtime Stack". In Illustration 7 the "Variables" tab is visible. It can display a list of all the variables defined in the program with their current values. Since the program has yet to execute, all the variables shown are empty vectors, represented by their parentheses being empty. One thing to note about the Debug Variables window is that if you close it by clicking on the "go away" box (the red "X" in the upper right corner in Windows, or the equivalent on other operating systems) the window will disappear, but it is only hidden. Its contents will not be lost. The window will reappear if you continue stepping through your program or if you select the Show Debug Window item of the Window menu on the Statistics101 main window. The Runtime Stack tab will be discussed later.
In the main window toolbar, if you now click on the Step button (see Illustration 3: Toolbar in debug single-step mode), the currently highlighted command will be executed, the affected variable(s) (if any) will be updated and highlighted in yellow in the Debug Variables window, the next line to execute will be highlighted (green) in the Main Window, and the status line in the Debug Variables window will be updated to also show the next line to execute.
By watching the variables changing in the Debug Variables window as you step through your program, you can spot unexpected behavior that might signal a bug.
There are three buttons and three check boxes below the variables display. These are:
Edit Variables: This button toggles between two states. Clicking this button allows you to edit any or all the variables shown in the Debug Variables window. When it is clicked, the button changes to appear as if it is pressed in and its label changes to Commit Changes. In the Commit Changes state, when you click the button, any changes you made to the contents of the Debug Variables window will be stored as new values to be used by your program as you continue stepping through it. To learn how to edit the variables, see the section "Editing variable values in the Debug Variables window", below.
Cancel Edits: This button is only enabled when the Commit Changes button is showing. Clicking the Cancel Edits button will cancel any changes you made to variables in the Debug Variables window.
Show Internal Variables: Most programs have additional internal values, created by Statistics101 to hold constants and intermediate results. By default, those are not displayed in the Debug Variables window. But you can view those internal variables by selecting the Show Internal Variables check box at the bottom of the Debug Variables window. De-selecting the check box will hide the internal variables.
Show Inactive Variables: A subroutine is "active" if it is the one containing the currently executing command, or if it invoked an active subroutine. A variable is "active" if it is a dummy variable or a local variable of an active subroutine. By default, only the variables that are in the main part of your program and in any active subroutines are shown. That is because if a subroutine is not active, then its variables are either empty or not relevant to the current computation. If you want to see the inactive variables you can do so by selecting the Show Inactive Variables check box.
Abridge Long
Vectors:
When this box is selected (checked), the Debug Variables window will
shorten any vectors that are longer than a length that you can set in
the User Preferences. This is selected by default. The reason for
shortening long vectors is that it can take a long time (seconds) for Statistics101
to write them to the Debug Variables window. Each time you "step" to
the next command during debugging, the writing of the variables happens
again, taking additional time. The shortened vector will be displayed
like this:
vecName: (1.0 2.0 3.0 4.0 5.0 *** 99996.0
99997.0 99998.0 99999.0 100000.0)
where the head of the vector is followed by three asterisks and then by
the tail of the vector. You can set the size beyond which vectors will
be shortened and the head and tail lengths in the "Debug" tab of the Preferences dialog.
Help: The final button showing in the Debug Variables window is the "Help" button. When clicked, it will display this document.
The five functions, other than "Help", controlled by the above buttons and check boxes are also accessible via a popup menu on the Debug Variables window by right-clicking (or doing whatever the popup trigger is for your operating system) anywhere in the editing panel. See Illustration 8, below. You can also toggle between the Edit Variables state and the Commit Changes state using the Ctrl-E keyboard accelerator when the Debug Variables window has the focus.
Illustration
8: Debug Variables Tab popup menu
As you step through your program when you are debugging it, you might want to change the value of a variable to see what effect that will have on your program. To edit one or more variables, click on the Edit Variables button. It will change into the Commit Changes button and the area showing the variables and their values will become editable. You can use normal editing techniques such as selecting (using the mouse), deleting (use delete or backspace keys), cutting (use Ctrl-X), copying (use Ctrl-C), and pasting (use Ctrl-V).
Each variable of your program represents one list. You can edit any or all the variables, changing their contents as you wish, but you can only put one list into one variable. You can even change the value of internal variables, and constants that were created with the NAME command. Use the normal Resampling Stats list syntax for lists (see Statistics101 Resampling Stats Commands). Thus, if the variable vec1 were displayed like this in the Debug Variables window,
vec1: (3 5 1 7 2)
you could change its contents by editing the above line to look like any of these:
|
Edited Line |
Description |
Result: vec1 becomes |
|---|---|---|
vec1: 23 |
Single number |
(23) |
vec1: (1 3 5 7 9) |
Simple list notation |
(1 3 5 7 9) |
vec1: 1,10 |
Sequence notation |
(1 2 3 4 5 6 7 8 9 10) |
vec1: 5#3 |
Multiple notation |
(3 3 3 3 3) |
vec1: hearts |
Named constant |
(hearts) assuming that hearts is defined in your program using the NAME command as described in the text below. If hearts is not defined, this will cause an error. |
vec1: (hearts diamonds clubs spades) |
List containing named constants |
(hearts diamonds clubs spades) Assuming the constants are defined in your program using the NAME command as described in the text below. If the constants are not so defined, this will cause an error. |
The last two examples will only work if the names hearts, diamonds, clubs, and spades had all been previously defined in your program using a NAME command like this one:
NAME hearts diamonds clubs spades
or this one:
NAME (1 2 3 4) hearts diamonds clubs spades
The following two examples are invalid and will produce error messages because vector variable names (those not defined with a NAME command) are not allowed to be elements of other vectors:
vec1: (1 2 someVariableName 3 4)
vec1: someVariableName
The following example is valid, but only the first value will be loaded into vec1 because any number that is not enclosed in parentheses is interpreted as a list and only one list is allowed per variable. Therefore, this example is trying to assign three lists to vec1:
vec1: 1 2 3
In the above line, vec1 will take on the value (1), ignoring the other two numbers. If you want it to have all three elements, you must express it as a single list like this:
vec1: (1 2 3)
Similarly, this next line is valid, but only the first list will be loaded into vec1; the second one, 5#3 will be ignored:
vec1: 1,10 5#3
Make sure that you do not change the name of a variable or remove the colon (:) from after the name. Doing either will cause an error because Statistics101 will be unable to interpret the line.
After you make your edits, click on the Commit Changes button. If you've made no error, the changes will be accepted and the button will revert to its Edit Variables state. If an error is detected, a message box will appear describing the error, the line containing the error will be highlighted in red, and the Commit Changes button will not change state.
If you get an error message, you can correct it by further edits in the Debug Variables window followed by clicking the Commit Changes button again. Or, if you want to discard your changes and return to the values that existed before you began the edit, you can click on the Cancel Edits button. If you do that, the Edit Variables button will return to its normal state, the Cancel Edits button will again become disabled, and the original program variables values shown in the Debug Variables window will be restored. If you actually introduced more than one error while editing the variables, only the first one detected will be reported. After you fix the first one and click the Commit Changes button, the next error will be reported.
If you are using the NEWCMD command to define one or more subroutines in your program, then the arguments of the subroutines will be displayed in the Debug Variables window along with the other variables in the program. The subroutine arguments, or "dummy" arguments are stand-ins for the real variables that will be supplied when the subroutine is invoked. These dummy arguments and the other "local" variables of the subroutine are displayed with the following naming convention:
Local variable names and dummy variable names will be prefixed with the name of the subroutine and a period.
Dummy variables will also have the name of their actual run-time argument shown in curly braces.
For example, if we had the following partial subroutine declaration,
NEWCMD NEWSUB arg1 arg2 'dummy arguments
 SQRT arg1 localVec 'local argument, "localVec"
. . .
END
and a short example program invoking it:
COPY (1 2 3) vec1
COPY (4 5 6) vec2
NEWSUB vec1 vec2
Then just after the debugger steps into the subroutine, the local variable, localVec, would be displayed in the Debug Variables window as follows:
NEWSUB.localVec: ()
and the dummy arguments would be displayed in the Debug Variables window as follows:
NEWSUB.arg1{vec1}: (1.0 2.0 3.0)
NEWSUB.arg2{vec2}: (4.0 5.0 6.0)
Note that each dummy argument has the name of its associated run-time actual argument enclosed in curly braces.
The reason for using the subroutine name as a prefix to the dummy's name or local variable's name is to allow the reuse of the same names without conflict in different subroutines and to allow a variable that is defined outside a subroutine and not named in a GLOBAL command to have the same name as a dummy variable or a local variable and yet be distinguishable from it.
If the debugger has stepped into a subroutine and you use the editing feature of the Debug Variables window to change a dummy's value, then that change will be propagated to the vector that the dummy is referring to. Likewise, if you change a non-local variable (one that is not in a subroutine and not declared global) that is being referred to by a dummy, then the value of the dummy will take on the same change. Outside a subroutine, the dummies and the non-local variables can be changed independently (although changing a dummy variable's value while the debugger is not inside that subroutine has no practical effect).
The Debug Variables window highlights in yellow any variable whose contents are changed by the last-executed command. Since a dummy variable is paired with an actual variable when stepping through a subroutine, if one changes, they both are changed and both are highlighted.
The term "runtime stack" is a software term referring to the method that a program uses to keep track of its place in a series of nested subroutine invocations. Illustration 8 shows the Debug window with the runtime stack tab selected. Note that the subroutines named in the runtime stack in this figure are not from the same program whose variables were shown in Illustration 7. That program used no subroutines. The runtime stack display is only useful in debugging programs that have subroutines. During debugging, as you step through your program, each time the program enters a subroutine, that subroutine will be listed in the Runtime Stack tab window. While in one subroutine, if the program enters another subroutine then the second subroutine will be listed above the first in the Runtime Stack tab window, and so on. The first subroutine listed is the innermost of a set of nested executing subroutines, the last subroutine listed is the outermost of the set of nested executing subroutines. The list of subroutine invocations grows and shrinks as you enter and exit nested subroutines during debug steps.
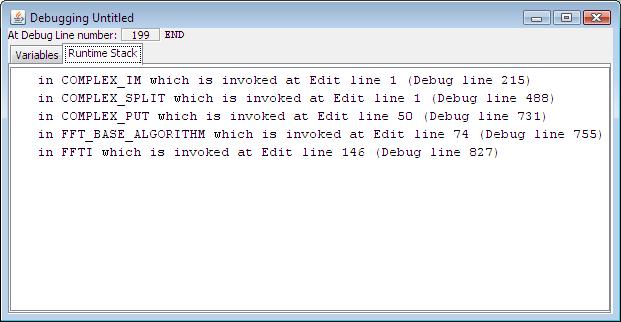
Illustration 9: Debug Runtime
Stack window
In
short, the Runtime Stack tab shows all the nested
subroutine
invocations that led the program to the command that will be executed
next. These are all the currently "active", or "executing",
subroutines. The last one in the list invokes the second-last which
invokes the third-last, etc. The first one in the list is the one
that contains the command that will execute next. That command to be
executed is shown in the status line at the top of the window. You
can read the contents of the above example from the top down like
this: "The command that will be executed when I click on the
"Step" button (![]() )
is the END command at line number 199 in the edit window's Debug tab.
That line is in the subroutine COMPLEX_IM which is invoked at line 1
in the Edit window or line 215 in the Debug window by subroutine
COMPLEX_SPLIT, which is invoked at Edit line 1 or Debug line 488 by
subroutine COMPLEX_PUT, etc." Reading the stack from the bottom
up, you could say, "subroutine FFTI is invoking
FFT_BASE_ALGORITHM which is invoking COMPLEX_PUT which is invoking
COMPLEX_SPLIT, which is invoking COMPLEX_IM, which contains the
command, END, which will execute when I click on the 'Step' button".
)
is the END command at line number 199 in the edit window's Debug tab.
That line is in the subroutine COMPLEX_IM which is invoked at line 1
in the Edit window or line 215 in the Debug window by subroutine
COMPLEX_SPLIT, which is invoked at Edit line 1 or Debug line 488 by
subroutine COMPLEX_PUT, etc." Reading the stack from the bottom
up, you could say, "subroutine FFTI is invoking
FFT_BASE_ALGORITHM which is invoking COMPLEX_PUT which is invoking
COMPLEX_SPLIT, which is invoking COMPLEX_IM, which contains the
command, END, which will execute when I click on the 'Step' button".
If you double-click on any line in the Runtime Stack window, your program in the Statistics101 main window's Edit or Debug tab will jump to and highlight the referenced line with a green highlight.
Sometimes, your bug might be many commands down in your program and you don't want to single-step over and over to get there. To avoid this, you can add a DEBUG command in your program at the point you want it to switch into debug mode. Then click the Run button. Your program will run as normal until it hits the DEBUG command and then it will enter the debug mode. From there you can single-step as described above.
You can put DEBUG commands anywhere in your program, but like any other command, DEBUG must be on its own line. There can be as many DEBUG commands in your program as you need.
Here's an example using DEBUG inside a loop where the DEBUG will be executed only after the program has looped a given number of times. On the 500th loop, the DEBUG command will be executed and the program will go into debug step mode. The commands in red were added to cause this behavior.
NAME 1 heads
NAME 2 tails
COPY (heads tails) coin
NAME 1000 rptCount
COPY 1 loopCounter
REPEAT rptCount
 IF loopCounter = 500
 DEBUG
 END
 SAMPLE 4 coin trial
 COUNT trial = heads headCount
 SCORE headCount results
 ADD 1 loopCounter loopCounter
END
COUNT results = 3 successes
DIVIDE successes rptCount probabilityOf3HeadsOutOf4
PRINT probabilityOf3HeadsOutOf4
There are two subroutines in the library (lib) that you can use to stop a program when certain conditions are satisfied. The first is DEBUG_AT, which stops the program after a given number of repetitions as in the example above. The second is DEBUG_IF, which stops the program when a test is satisfied. You can see examples of the use of these subroutines in the description of the DEBUG command.
Breakpoints are similar to the DEBUG command except they are more flexible, easier to use, and do not require you to make any changes to your program. A breakpoint is any line in your program at which you want the program to automatically stop and enter debug mode.
To set or remove a breakpoint, the Debug tab of the program window must be displayed. This is the programming panel window with the light gray background. You may set a breakpoint on any executable line in a program. Comment lines are not executable. The commands GLOBAL, NAME, and DECLARE are not executable, i.e., they take effect during compile time, just prior to the program's start, not during its run-time. Therefore, you cannot set breakpoints on comment lines or lines containing those three commands.
The easiest way to set a breakpoint at an executable line is to double-click that line when the program window's Debug tab is displayed. When a breakpoint is set, its line will be highlighted with a blue highlight. In Illustration 5 above you can see that two breakpoints are set, one at line 8 and one at line 11. You remove a breakpoint the same way: by double-clicking an existing breakpoint.
In short, double-clicking a line of your program (in the Debug tab of the program window) toggles the state of the breakpoint for that line: If there is no breakpoint, double-clicking will set it; if there is a breakpoint, double-clicking will clear it.
An
alternative way to set or clear a breakpoint is to right-click on the
target line and use the popup menu selection Toggle Breakpoint. A third
way is to use the keyboard accelerator key, Ctrl-B, which will toggle
the breakpoint at the line that the cursor is on.
You can set a breakpoint before you
start the
program running, while it is running normally, while it is running at
full speed in debug mode, or while it is in debug step mode. If the
program is running when you set the breakpoint, it will continue to
run until it reaches the breakpoint, then it will stop there and
enter debug step mode. After the program stops at a breakpoint, you
can single-step, using the ![]() button from there and observe the program variables in the Debug
Variables window. Or you can click the continue button,
button from there and observe the program variables in the Debug
Variables window. Or you can click the continue button, ![]() ,
to make the program run at full speed until it reaches the next
breakpoint or the end of the program.
,
to make the program run at full speed until it reaches the next
breakpoint or the end of the program.
You can set as many breakpoints as you want in your program. If you want to clear all the breakpoints, you can do so with the Run menu's or the popup menu's Clear All Breakpoints menu selection. You can also use the keyboard shortcut, Alt-B to clear all breakpoints.
If you load a new program using the File>Open menu item, any existing breakpoints will be cleared.
Breakpoints
are associated with the program's line numbers. Consequently, if you
set a breakpoint at say, line 100, and later insert a command or even a
comment at an earlier line, then the former line 99 becomes line 100
and is therefore the new target of the breakpoint. So, if you insert
(or delete) lines above existing breakpoints, you will need to clear
the affected breakpoints and reestablish them at the desired target
lines.
There are two ways to exit the debug
mode. You can
click on the Continue
button, ![]() ,
which will cause the program to continue at normal speed until it
completes or again reaches a breakpoint or a DEBUG
command. If the program is one that takes a number of seconds to
complete, you might notice that the Continue
button has now turned into a Pause
button,
,
which will cause the program to continue at normal speed until it
completes or again reaches a breakpoint or a DEBUG
command. If the program is one that takes a number of seconds to
complete, you might notice that the Continue
button has now turned into a Pause
button, ![]() .
If you click on the Pause
button while the program is running at normal speed, the program will
stop where it is and go back into Step mode. You can go back and
forth between these two states until the program completes.
.
If you click on the Pause
button while the program is running at normal speed, the program will
stop where it is and go back into Step mode. You can go back and
forth between these two states until the program completes.
The second way to exit the debug mode
is to abort
the program. Click on the Abort
button, ![]() .
You will be asked to confirm the abort. When you do, the program will
terminate, exiting the debug mode.
.
You will be asked to confirm the abort. When you do, the program will
terminate, exiting the debug mode.