Undo Each invocation reverses the most
recent change (that hasn't already been undone) made to the Edit
Window contents since the last save. There is no limit to the number
of undos. Any pending undos are discarded when you save to a file or
if you load a new program using the File>Open
menu selection.
Redo Each invocation reverses the most
recent Undo action that hasn't already been redone.
Cut Removes the selected text from the
Edit Window and saves it in the clipboard. This selection is
disabled if the Debug tab is forward.
Copy Copies the selected text from the
Edit Window or the Output Window and saves it in the clipboard.
Paste Pastes the text from the
clipboard into the Edit Window replacing any selected text or
inserting the clipboard text at the cursor in the Edit Window. This
selection is disabled if the Debug tab is forward.
Paste from Spreadsheet Pastes the
contents of the system clipboard into the Edit Window at the cursor.
The clipboard contents are assumed to have been copied from a
spreadsheet program such as Microsoft Excel by selecting the desired
cells in the spreadsheet and choosing Copy (Ctrl-C). If the
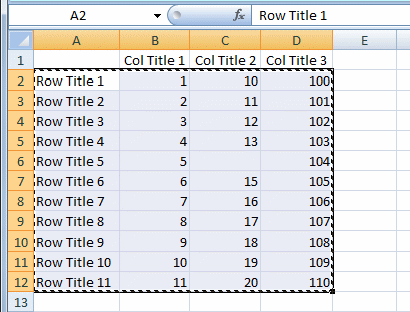
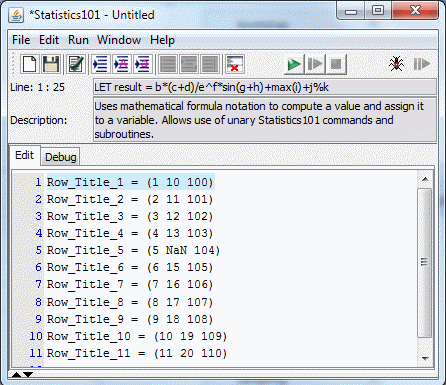
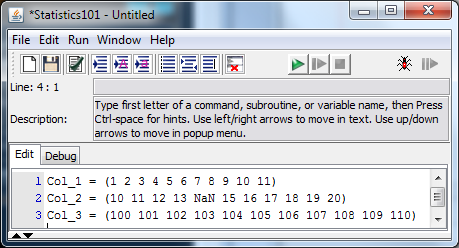
spreadsheet selection has row titles only, Statistics101 will
automatically convert the rows into LET commands of the form
row_title = (1 2 3 ...).
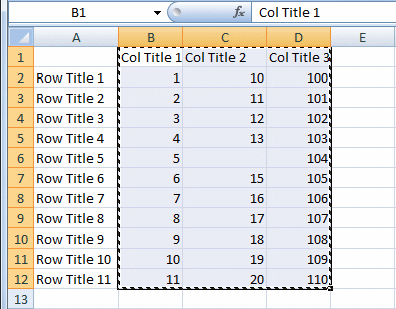
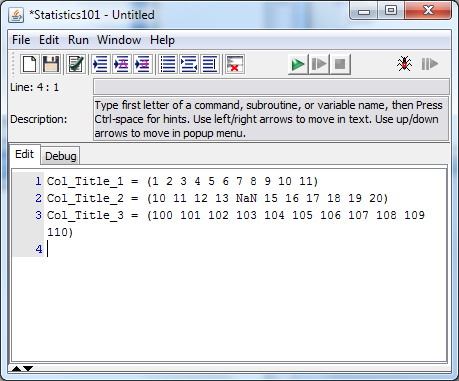
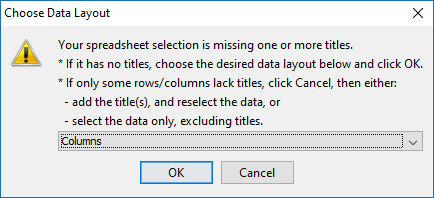
If the selection has column titles only, Statistics101 will
automatically convert the columns into LET commands of the form
column_title = (1 2 3 ...). The selection must not have both row titles and column titles. Any spaces in the titles will
be replaced by underscores. For example "row title" will
become "row_title" so that it is a valid vector name. If
you include row or column titles in your selection, then all rows or
columns must have titles, i.e. there must be no empty title cells.
Any empty data cells (non-title cells) in the spreadsheet will be
replaced with "NaN".
If the selection has neither
row nor column titles, you will be asked to choose whether it should
be interpreted as rows or columns. In this case, row or column names
will be created in the form "row_1",
"row_2",
etc., or "col_1",
"col_2",
etc., respectively to construct LET commands with valid vector
names. The numerical suffixes on the created row and column names
will increment by 1 for each row or column that you paste. If
you want to restart the counts from 1, hold down the Shift key while
you select the menu item "Paste from Spreadsheet" (Shift-Clicking). The
count for both rows and columns will be restarted from 1. The Shift key
reset feature only works when you use the "Paste From Spreadsheet" menu
item using the mouse. It will not work with the Alt-V shortcut key.
The
Paste from Spreadsheet feature automatically recognizes tabs or
commas or semicolons or pipes ("|") as row/column
delimiters without user intervention. If
your selection has a different delimiter (rare), you can change the
delimiter by holding down the Ctrl key while you click on the "Paste
from Spreadsheet" menu item (Ctrl-clicking). You will be asked to enter
a single character delimiter. The delimiter you enter will be used
until either you change it again by the same method, or you make a
selection that uses tabs, commas, semicolons or pipes as delimiters, or
until you restart the Statistics101 program.
The change delimiter feature only works when you use the "Paste From
Spreadsheet" menu item using the mouse. It will not work with the Alt-V
shortcut key.
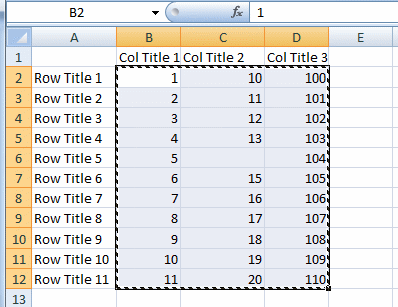
The
following diagrams show different selections in a spreadsheet and
the results of using "Paste from Spreadsheet" to paste the
selection into the editor.
Include Lib File... Opens a
File Selection dialog to let you choose a file containing
subroutines from the lib directory. After you select a file and
click OK, an INCLUDE
command for that file will be automatically added to the top of your
program in the Edit Window.
-
Refresh Subroutine Index
Rescans the supplied subroutine library and the user's default library
to rebuild the subroutine indexes. The subroutine indexes are used by
the Subroutine Browser (F5), the Command/Subroutine Index (F3), and
other functions of the Statistics101
help system. The indexes are built when the program launches, so this
refresh is only needed if you make a change to a subroutine in your
default library while Statistics101 is running.
(Help) Commands by Name Displays a list of
all the Statistics101 commands. Selecting a command will
cause a help window to appear with the detailed description of the
command. If you hold down the SHIFT key when making the selection,
the command will be inserted in your program at the cursor position.
If you pause the mouse pointer over any one of the command names, a
tooltip will appear describing the command.
(Help) Subroutines from Lib by Name Displays a list of all the subroutines that are in the /lib
directory. Selecting a subroutine will cause a help window to appear
that contains the file from /lib that defined the subroutine so that
you can see its comments and detailed definition. If you hold down
the SHIFT key when making the selection, the subroutine will be
inserted in your program at the cursor position and an INCLUDE
command for the subroutine's file will be inserted at the top of the
program unless an identical one is already there.
If you
pause the mouse pointer over any one of the subroutine names, a
tooltip will appear describing the subroutine. If you add files
containing your own subroutines to the lib directory, their names
will be added to the list. The first menu item is always "Refresh
List". This item will cause Statistics101 to re-scan
the contents of the lib directory and rebuild the list of subroutine
names. You might need to do this if you added (or removed) a
subroutine file to the lib while Statistics101 was running
because Statistics101 performs the scan at startup and not
again until you request it via "Refresh List".
(Help) Commands and Subroutines by Category Displays a list of categories, each of which leads to a list of
Statistics101 commands and subroutines from the /lib
directory that are in each category. Commands are shown in bold in
this list, subroutines are shown in plain text. Selecting a command
will cause a help window to appear with the detailed description of
the command. Selecting a subroutine will cause a help window to
appear that contains the file from /lib that defined the subroutine
so that you can see its comments and detailed definition. If you
hold down the SHIFT key when making the selection, the command or
subroutine will be inserted in your program at the cursor position
and if it is a subroutine, then if needed, an INCLUDE
command will be inserted at the top of the program. The above figure
shows this menu fully extended.
If you pause the mouse
pointer over any one of the command or subroutine names, a tooltip
will appear describing the command or subroutine. If you add files
containing your own subroutines to the lib directory, their names
will be added to the list. The first menu item is always "Refresh
List". This item will cause Statistics101 to re-scan
the contents of the lib directory and rebuild the list of subroutine
names. You might need to do this if you added (or removed) a
subroutine file to the lib while Statistics101 was running
because Statistics101 performs the scan at startup and not
again until you request it via "Refresh List".
Indent Program Indents any non-comment
lines enclosed by REPEAT...END,
WHILE...END
, and IF...
END
commands to make it easier to read the text. Does not change the
typographical case of any commands. Operates on either the Edit
Window or the Debug Window, whichever one is showing. If you hold
down the Shift key when selecting this menu item, then comment lines
(those beginning with an apostrophe) will also be indented to the
same level as their surrounding program text.
Indent Program, Upper Case Same
as above Indent Program command except that all the commands in the
Edit Window will be rendered in upper case. Operates on either the
Edit Window or the Debug Window, whichever one is showing. If you
hold down the Shift key when selecting this menu item, then comment
lines (those beginning with an apostrophe) will also be indented to
the same level as their surrounding program text.
Indent Program, Lower Case Same
as above Indent Program command except that all the commands in the
Edit Window will be rendered in lower case. Operates on either the
Edit Window or the Debug Window, whichever one is showing. If you
hold down the Shift key when selecting this menu item, then comment
lines (those beginning with an apostrophe) will also be indented to
the same level as their surrounding program text.
Show/Hide Line
Numbers Displays line numbers at the left of each line in the
Edit Window. When line numbers are visible, the longer text lines
will wrap if the window is too narrow. When line numbers are not
visible, the text will not wrap. Operates on both the Edit Window
and the Debug Window regardless of which is showing.
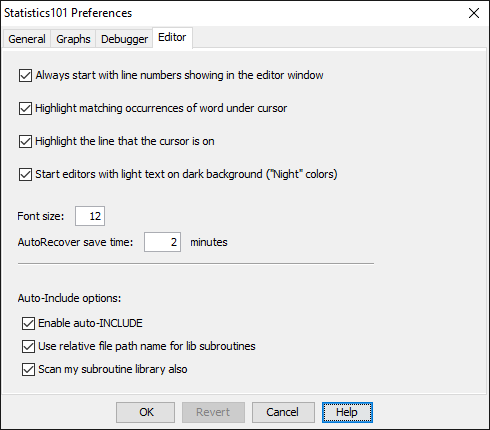
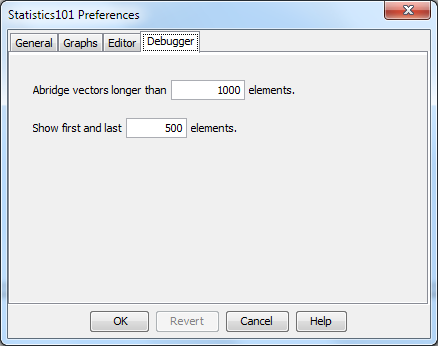
Preferences...
Opens a dialog window that lets you select default options for the
Statistics101 program. Your selections will be applied
immediately when you click the OK
button on the dialog. They will also be stored so that the next time
the program is run it will start up with the options you selected.
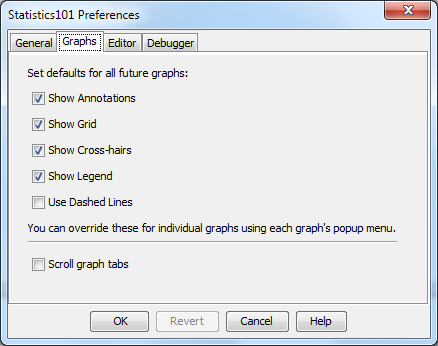
The preferences dialog has four tabs. Each tab sets the preferences
for a different category of features. See the next figure and the
bullet points below it for details.
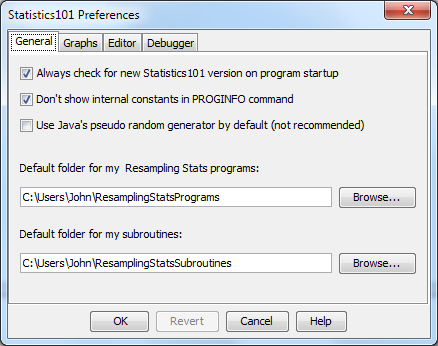
Always
check for new Statistics101 version on program
startup. If this checkbox is selected, then each time you start
Statistics101 it will check the www.statistics101.net
website to see if there is a new version. If there is a new version,
a message dialog box will appear tell you so. If yours is the latest
version, the program will startup as usual with no notification.
Your computer must be connected to an active Internet port for this
to work. If your Internet connection is unavailable, the program
will not notify you, it will just proceed to its normal operation.
If you want to check manually for an update, use the Help>Check
for update... menu selection.
Don't show
internal constants in PROGINFO
command. When this checkbox is selected, the
PROGINFO
command will not print out the internal variables when it
outputs the program variables to the output window.
Use Java's
pseudo random generator by default (not recommended). When this
checkbox is selected, Statistics101 will default to using the
pseudo-random number generator provided by the Java language's
java.util.Random class. Otherwise, all the random numbers used by
Statistics101 are generated by the Mersenne
Twister algorithm, which is considered to be superior for
simulation applications. For details on the Java class, see
http://java.sun.com/j2se/1.4.2/docs/api/java/util/Random.html.
You can override this default setting using the SEED
command.
Default folder
for Resampling Stats programs: If you want to choose a folder to
store your Resampling Stats programs other than the one
provided with the program, enter the folder's path in the text box.
You can give it any name you prefer and put it in any directory for
which you have write privileges. Or, you can use the Browse
button to find the folder you want to use.
Default
folder for my subroutines: If you want to choose a folder to
store Resampling Stats subroutines that you write other than
the default chosen by the program, enter the folder's path in the
text box. You can give it any name you prefer and put it in any
directory for which you have write privileges. Or, you can use the
Browse
button to find the folder you want to use. The subroutines in the
files in this folder will be scanned and made visible in the
Subroutine Browser.
Show
Annotations.
When selected, all graphs will, by default, display the X and Y
values of the curves graphed at the position of the mouse pointer.
If deselected, the annotations will not be displayed. You can
override the default setting for any graph using the graph's popup
menu. See
Graph
Features.
Show
Grid.
When selected, the vertical and horizontal grid lines will be
displayed on all new graphs. When deselected, the grid lines will
not be displayed. You can override the default setting for any graph
using the graph's popup menu. See
Graph
Features.
Show
Cross-hairs.
When selected, the vertical and horizontal cross-hairs will be
displayed on all new graphs at the position of the mouse pointer.
When deselected, the cross-hairs will not be displayed. You can
override the default setting for any graph using the graph's popup
menu. See
Graph
Features.
Show
Legend.
When selected, the legend describing which curves have which colors
will be displayed on all new graphs. When deselected, the legend
will not be displayed. You can override the default setting for any
graph using the graph's popup menu. See
Graph
Features.
Use
Dashed Lines.
When selected, the curves displayed by a graph will, by default, be
distinguished by a unique sequence of short and long dashed lines in
different colors. When deselected, the curves will be displayed as
solid lines in different colors. You can override the default
setting for any graph using the graph's popup menu. See
Graph
Features.
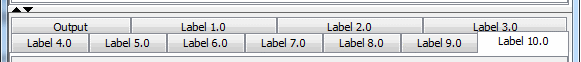
Scroll
graph tabs.
When selected, if there are too many graphs showing in the output
window such that their tabs won't fit within the window's width,
then the tabs will display in one row with a scroll button that will
step through the tabs. When deselected, the tabs will display as
multiple rows across the window's width, if necessary. Here is the
view if the box is checked (tabs scroll):
Always
start with line numbers showing in the editor window.
If this checkbox is selected, then Statistics101's
Program Panel will default to displaying line numbers. If the
checkbox is unchecked, the Program Panel will default to not showing
the line numbers. Either way, you can still toggle the current
display of line numbers using the Ctrl-L keyboard shortcut or the
Edit>Show/Hide
Line Numbers
menu selection.
Highlight
matching occurrences of word under cursor.
If this checkbox is selected, then whenever you put the cursor
within a word, all instances of that word in the program will become
highlighted. If the checkbox is not selected, then words that match
the word under the cursor will not be highlighted.
Highlight
the line that the cursor is on.
If this checkbox is selected, the line that the insertion point
cursor is on will be highlighted in a light blue color to emphasize
it. If the checkbox is not selected, then the line containing the
cursor will not be highlighted.
- Start editors with light text on dark background ("Night" colors).
If this box is checked, the editor panels in the "Edit" and "Debug"
tabs will use white for text and dark colors (dark blue and gray,
respectively) for the background. If unchecked, the backgrounds will be
white and light gray, respectively, with black text. The Night colors
are helpful for people who have "floaters" in their eyes.
Font
size.
Enter a font size. This size will be used for all text windows in
Statistics101.
Autorecover
save time:
This
sets how often the contents of the editor are automatically saved to
a recovery file. Enter an integer number of minutes. By default the
program is set to save the editor contents automatically every two
minutes. If you want to turn off this feature, enter 0 as the
AutoRecover
save time.
Whether or not you disable the feature by entering a zero,
Statistics101
will still save the contents of the editor in a recovery file
whenever you run your program.
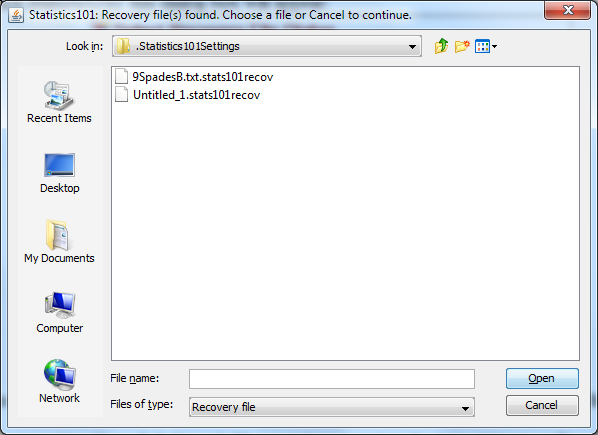
If Statistics101
stops unexpectedly or you have to kill it for some reason, the
recovery file remains on your hard drive so that the next time you
start Statistics101
you will be given a chance to recover any work you had done up to
the last autosave. If
there is a recovery file, then the next time you launch
Statistics101
this dialog box will appear listing the available recovery file or
files:
To
recover, select a recovery file from the list, then click Open. The
contents of the recovery file will be copied into the editor.
If
you don't want to recover any of the files in the list during your
current session, then click Cancel. The recovery dialog will
disappear and Statistics101
will open normally with the editor empty. The next time you start
Statistics101
you will again see the recovery dialog box. If you don't plan to use
the recovery file and want to delete it, then click Open to allow
Statistics101
to copy the recovery file into the editor, then use the File>New
menu item to clear the editor's contents. The old recovery file will
be deleted. The recovery files are in a folder named
".Statistics101Settings" within your user home directory
and have the extension ".stats101recov". You can delete
them manually if you wish, but don't delete any other files from
that directory.
Enable
auto-INCLUDE.
When this checkbox is selected, Statistics101
will insert an INCLUDE
command for any subroutine that your program invokes that doesn't
already have its file included. This applies to any subroutines in
the lib directory and, if the "Scan
my subroutine library also"
box is selected, it applies to subroutines that are in the
ResamplingStatsSubroutines
directory. The INCLUDE
command(s) will be added at the top of the program in the editor
when a syntax check occurs. A syntax check occurs when called for by
selecting Run>Check
Program Syntax
menu (Ctrl-K) or whenever the program is run. This ability to insert
missing INCLUDE
commands is called the auto-INCLUDE feature. It works like this: say
you are writing a program and you need to compute a factorial, so
you invoke the FACTORIAL subroutine. That subroutine is in the
"mathCommands.txt" file in the "lib" directory.
Therefore your program needs an INCLUDE
command naming that file so Statistics101
can find the subroutine. If you don't type in the INCLUDE
file yourself, then when you run a syntax check or run the program,
Statistics101
will insert the needed INCLUDE
command itself.
Use
relative file path name for lib subroutines.
When this checkbox is selected, the auto-INCLUDE
feature will use a path that is relative to the user's working
directory for any INCLUDE
statements that it inserts automatically for subroutines. When the
checkbox is not selected, the auto-INCLUDE
feature will use the full file path to identify the subroutine file
to be included. If you have installed Statistics101
normally, the working directory should be the directory containing
the "Statistics101.jar" file. A relative file path is a
partial path that omits the path to the working directory. For
example, if your working directory is "c:\program
files\statistics101\" and the full path to the file to be
included is "c:\program
files\statistics101\lib\mathCommands.txt", then the relative
file path name will be "lib\mathCommands.txt".
Scan
my subroutine library also.
When this checkbox is not selected, the auto-INCLUDE
feature will only insert INCLUDE
commands for subroutines that are in the "lib" directory
that comes with the program. When this checkbox is selected, the
auto-INCLUDE
feature will also insert INCLUDE
commands for subroutines that are in the directory that is selected
by the Default
folder for my subroutines
text
box in the General
tab of the preferences dialog.
Either the full path or the relative path will be used for
subroutines from your user subroutine directory, depending on the
setting of the "Use relative file path name for lib
subroutines" checkbox.